
Advanced Sabermetrics for MLB Crypto Betting
 Available in US
Applying Advanced Statistics to Beat Sportsbook Lines
I went through a phase, several years into this, where I read every sabermetric primer I could find and absorbed all of it. Then I lost money for two months because I had been using the metrics to confirm that I understood the game more deeply than the public, rather than to find specific points where the public’s model and the actual likelihood of an outcome diverged. Those are not the same exercise. The first one feels good and rarely produces edge. The second one is dryer, more procedural, and is the only thing that actually matters for a bettor.
This piece is about four sabermetric inputs that produce edge against a typical crypto sportsbook line. Not every advanced stat is a betting tool. Some of them – defensive runs saved, win probability added, leverage index – are excellent for understanding what happened, but they are backward-looking and the market has already priced in their content by the time you reach for them. The four below are predictive in a way that public lines do not always reflect. The point of this guide is to use them for that, and only for that.
xERA versus ERA, where the noise lives
The traditional ERA – earned runs allowed per nine innings pitched – is a flawed measurement because it averages two things that move independently. The first is the pitcher’s quality of pitching: how often he generates strikeouts, walks, ground balls, and weak contact. The second is everything outside his direct control: the defence behind him, batted-ball luck, sequencing of hits and outs. Across a full season the second component averages out toward zero. Across the first half of a season – which is when betting markets are most active in their pricing – it does not.
Expected ERA – xERA – strips out the noise component and reports what the pitcher’s batted-ball profile and strikeout-walk numbers should have produced under league-average defence and luck. The metric is published on Baseball Savant and updates daily. The gap between a pitcher’s actual ERA and his xERA is the noise that the public model has not yet adjusted away.
The bet I look for is a pitcher with a season ERA notably above his xERA, scheduled against a lineup the public regards as a tough matchup. The line on the pitcher’s team is wider than it should be, because the public is anchored to the actual ERA. If the xERA reads three-and-a-half against a posted four-and-a-half ERA, the underlying performance is much closer to the lineup’s expected difficulty than the headline number suggests, and the moneyline on his team is generally underpriced.
The reverse trade – pitcher with ERA below xERA, due for regression – is harder to time. Public models do eventually catch up, but the catching up is uneven and often happens after one bad start that drags the season ERA toward the underlying. The trade requires patience and a willingness to be wrong in the short term.
Barrel rate and what it tells you about home runs
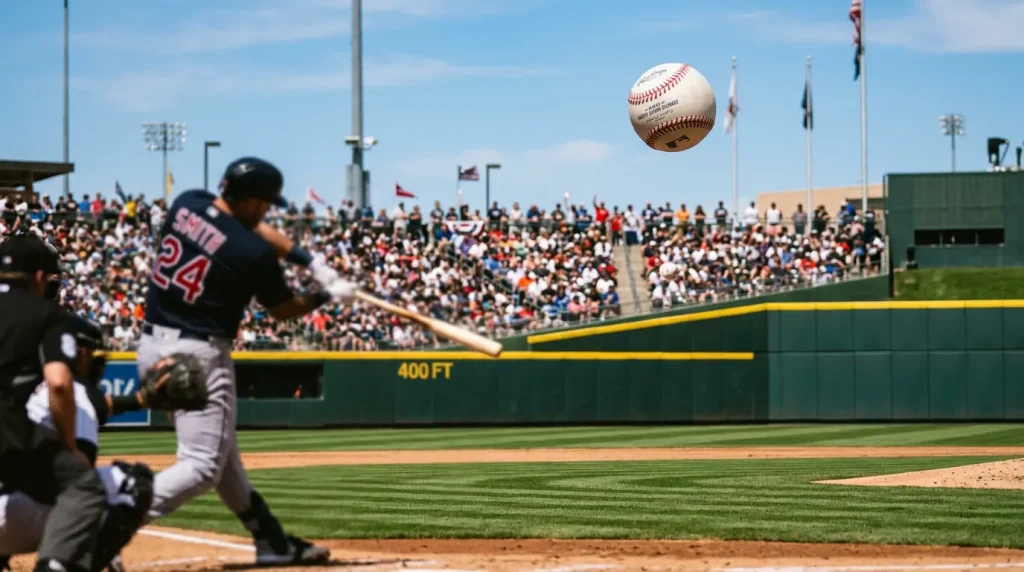
Barrel rate is the percentage of a hitter’s batted balls that leave the bat with the launch angle and exit velocity that historically produce extra-base damage. The threshold definitions are public and the data flows directly from Statcast. A hitter with an above-league-average barrel rate is making the kind of contact that turns into doubles and home runs whenever the ball is not hit directly at a fielder.
The relevance to betting is that home run prop markets – the single most popular MLB market by volume on the largest fiat operator in 2025 – price predominantly off the public-facing slugging percentage and home run total, both of which are noisy in any single-month window. Barrel rate is more stable across a smaller sample and predicts forward home run production better than season-to-date totals do.
The trade is a hitter whose barrel rate has been climbing across a recent month, against a pitcher with elevated HR per nine innings, in a hitter-friendly park, with a wind component that supports flight. The home run prop on that hitter at the typical plus-four-hundred to plus-five-hundred coefficient is occasionally underpriced relative to the model. Over a full season, this is one of the more reliable streams of value among prop markets, with the standard caveat that variance on plus-money props is high enough that bankroll discipline matters more than pick selection.
Bullpen fatigue and the back-half of the game
Bullpens are where games are decided in modern baseball. Starters work to the fifth or sixth, the bullpen takes over, and the marginal runs that move totals from under to over almost always come from the relief pitching. The metric that matters here is not a single number but a recent-usage profile: which bullpen arms threw in each of the previous two or three days, how many pitches each threw, and which of them are unavailable in the current game.
The data is public – every team posts pitcher availability – but it is reported in a form that public betting models often do not absorb cleanly. A team whose top three relievers each threw twenty-plus pitches in each of the previous two games is operating with a depleted high-leverage corps tonight, which means the seventh, eighth and ninth innings are going to be handled by lower-quality arms. The total runs over is meaningfully more likely than the public line suggests; the run line on the opposing team is similarly underpriced.
Crypto sportsbooks generally lag public bullpen analytics by several hours after a posted lineup, because the manual work of incorporating bullpen state into a model is non-trivial and is not always automated even at the larger global operators. Cloudbet’s 2026 numbers showed thirty per cent year-on-year growth in baseball volume on a platform spanning more than forty sports and esports, and that growth is part of why the larger operators have been investing in tighter pre-game pricing – but the gap between sharp public models and operator pricing on bullpen state is one of the longer-running edges that survives.
Practical application: where to find the data and how to use it
Baseball Savant and FanGraphs are the two free public sources for the metrics above. Baseball Savant publishes Statcast data including barrel rate, exit velocity, expected stats and pitch movement. FanGraphs publishes more conventional sabermetric outputs including FIP, SIERA, leverage indices, and projection systems. Between the two of them, the input data for any reasonable betting model is freely available and updated daily.
The trap is treating the model as the bet. A model is a tool for finding mispriced lines, not a substitute for actually placing the bet at a moment when the line is mispriced. The discipline of doing the modelling work, then waiting for a line to be at a price the model says is value, then placing the bet at that price, is harder than it sounds. Most bettors who study sabermetrics either fail to wait – placing bets at every line their model produces an opinion on, regardless of price – or wait too long and miss the moment the line was actually sitting at value before the public moved it. The model is half the work; the timing is the other half.
Hit-a-home-run prop markets specifically tied to barrel rate have a useful property: they are high-variance, plus-money, and the model is often more accurate than the line because the line is anchored to public-facing slugging numbers. The bettor who runs barrel-rate-driven home run picks for an entire season, sized small, will produce a recognisable distribution of returns – long miss streaks punctuated by occasional fat winners – and will end up positive if the model is right. That is what a sustained sabermetric advantage actually feels like in operation.
Sabermetric analysis is most useful when paired with the matchup-level reading that drives any moneyline or run line decision – for the broader pitcher-side framework, see my piece on starting pitcher matchup analysis for crypto MLB bets.
Articles
Written by the editors at BlockPlate.
