
Pitcher Strikeout Props for Crypto Baseball Bettors
 Available in US
Analyzing K/9 Metrics for Sportsbook Prop Value
I run a small spreadsheet during the season that tracks how each prop type I have wagered on has performed against the closing line. Hit-a-home-run props are roughly break-even against close – the line has caught up with my reads, and the variance is high enough that I cannot tell from the sample whether I am positive or negative. Total bases props are a coin flip. Strikeout props are the one row in the spreadsheet that has been consistently positive across enough seasons that I trust the result. The reason is structural. Strikeout output is more predictable than offensive output, the inputs are public, and the operator’s line tends to anchor on season-to-date totals that lag the underlying data faster than the markets expect.
The 2025 MLB regular season produced 71.4 million attendance and games averaging two hours thirty-eight minutes – three minutes faster than the year before – with the pitch clock continuing to compress the per-game pitch count. The shorter games are not shorter strikeouts; if anything, the rate of strikeouts per inning has held flat or increased slightly. Combined with the increasing concentration of strikeout-heavy starters at the top of MLB rotations, the supply of prop-friendly pitching matchups has grown across the past three seasons. This piece is about how to actually exploit that supply.
The four inputs that drive the line
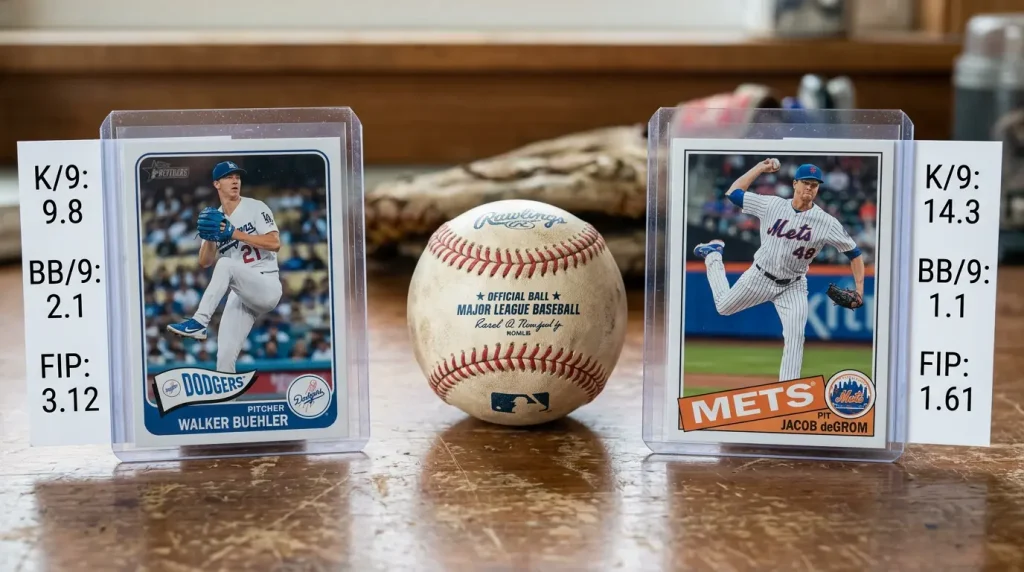
The first input is the starter’s K/9 – strikeouts per nine innings – across the season-to-date and across the most recent rolling window. A pitcher with a season K/9 of nine and a recent rolling K/9 of eleven is in the middle of a hot streak that the public model often under-weights. The reverse – season K/9 nine, recent six – flags either fatigue or a velocity issue that is sometimes visible before the operator’s line absorbs it.
The second input is the opposing lineup’s K-rate. A lineup with a high collective strikeout rate against the relevant pitcher handedness is structurally vulnerable to a high strikeout outing. The data is public on FanGraphs and updates daily. The combined number – pitcher K/9 multiplied by an adjustment factor for the opposing lineup’s K-rate – is a reasonable first-cut estimate of expected strikeouts in a typical seven-inning outing.
The third input is expected innings pitched. A starter who is on track to throw seven innings has more strikeout opportunity than a starter who is being managed to five innings on a workload-protection schedule. The data here is more difficult to read precisely because workload management is announced inconsistently across teams. The clearest signal is recent outings – a starter who has thrown six or fewer innings in three consecutive starts is on a managed workload and probably will not break the pattern, regardless of his K/9.
The fourth input is the umpire’s strike zone. The home plate umpire for a given game is announced ahead of time and the public data on each umpire’s called-strike rate is available on UmpScorecards and similar sites. A pitcher whose game gets a high-strike-rate umpire – a generous zone – picks up borderline strikes that other umpires would have called balls, which converts to additional swinging strikes and strikeouts. The effect is real but small at the prop-line margin, perhaps half a strikeout in expectation across an outing.
The pitch-clock effect and the pace question
The pitch clock has accelerated games and increased the pitch volume per inning slightly, which translates to a marginal lift in expected strikeouts per starter outing relative to pre-2023 baselines. The exact magnitude depends on the pitcher; flame-throwers with high pure-stuff rates have benefited more from the pace increase than command-and-control pitchers because the additional swinging-strike opportunities scale with stuff quality.
The under-discussed effect is on innings management. With games shorter, managers are slightly more willing to leave a starter in for the seventh than they were in the long-game era, because the cumulative pitch count at the same inning is lower. A starter who would have been pulled at one hundred pitches after six innings under old pacing might now reach the seventh because his pitch count is at ninety. The extra inning of work converts to one to three additional strikeout opportunities, which is meaningful at the prop-line margin.
The FanDuel sportsbook director Matthew Heffley made an observation about the home-run prop market that applies analogously to strikeouts – that bettors associate specific operators with specific markets, and the volume on those signature markets is concentrated enough to support active trading-desk attention. Strikeout props at the largest crypto operators have been getting more analytical attention as the volume has grown, which means the easy edges have closed somewhat over time. The remaining edges are smaller and require sharper modelling to capture.
The market structure: typical lines and ranges
Strikeout prop lines for a typical MLB starter run from four-and-a-half on the lowest-K starters in their format to ten-and-a-half on the highest-K starters in long-leash usage. The most common bet shape is over six-and-a-half to over eight-and-a-half, which is where the bulk of mid-rotation starters land. The decimal pricing on these lines typically runs from 1.85 to 2.10 on the over and 1.75 to 1.95 on the under, depending on operator and the market’s recent flow.
Alternate strikeout lines are widely available – over five-and-a-half, over six-and-a-half, over seven-and-a-half – at a spread of decimal prices, with the higher numbers paying out more in plus-money territory. The alternate at a half-strikeout above the standard line is generally where I find the most consistent value when the underlying model says the standard line is too low. Picking up an additional half-strikeout of cushion at decimal 2.40 instead of taking the standard line at 1.90 is the kind of risk-adjusted shape that matches a high-conviction read.
Same-game parlay shapes that combine a strikeout prop with the moneyline on the same starter’s team are widely offered. The correlation is real – a starter who throws a strong strikeout outing is more likely to win his team the game – and the operator’s SGP pricing usually under-prices this correlation by a small margin. The combined ticket is sometimes a value that neither individual leg would offer.
The bankroll shape that survives strikeout-prop variance
Strikeout prop variance is high. A pitcher whose model expectation is eight-and-a-half strikeouts in a typical outing has a one-standard-deviation range of roughly plus or minus two strikeouts around that mean, which means the over-eight-and-a-half wager fails meaningfully often even when the model was correct on the underlying expectation. The win rate at the standard line on a sound model is typically in the fifty-five to sixty per cent range, which produces positive expected value at decimal 1.90 but with substantial variance bursts.
I size strikeout props at the same standard unit as my MLB moneyline plays, which is between one and two per cent of bankroll. The variance is high enough that going larger produces drawdowns that compound faster than the win rate can recover from. Across a season of strikeout-prop volume – typically forty to sixty wagers across a focused subset of starters – the cumulative win rate around fifty-seven per cent at decimal 1.90 produces a positive ROI of around three to four per cent on volume. That is a reasonable return for the work involved and is consistent across the seasons I have tracked.
The discipline question is which starters to actually wager on. The best results have come from focusing on a small subset of high-K starters whose lines move predictably with public attention, and ignoring the long tail of mid-rotation arms whose K/9 and innings expectations are noisier. Twenty starters across MLB carry about ninety per cent of the strikeout-prop volume that I find tradable; the other two hundred starting pitchers in the league are not where the value concentrates.
The same data inputs that drive strikeout prop value drive the broader matchup picture for moneyline and run line decisions – pitcher K/9, opposing K-rate, expected innings – and my piece on starting pitcher matchup analysis for crypto MLB bets walks through how to read all of it together.
Articles


Prepared by the BlockPlate editorial staff.
